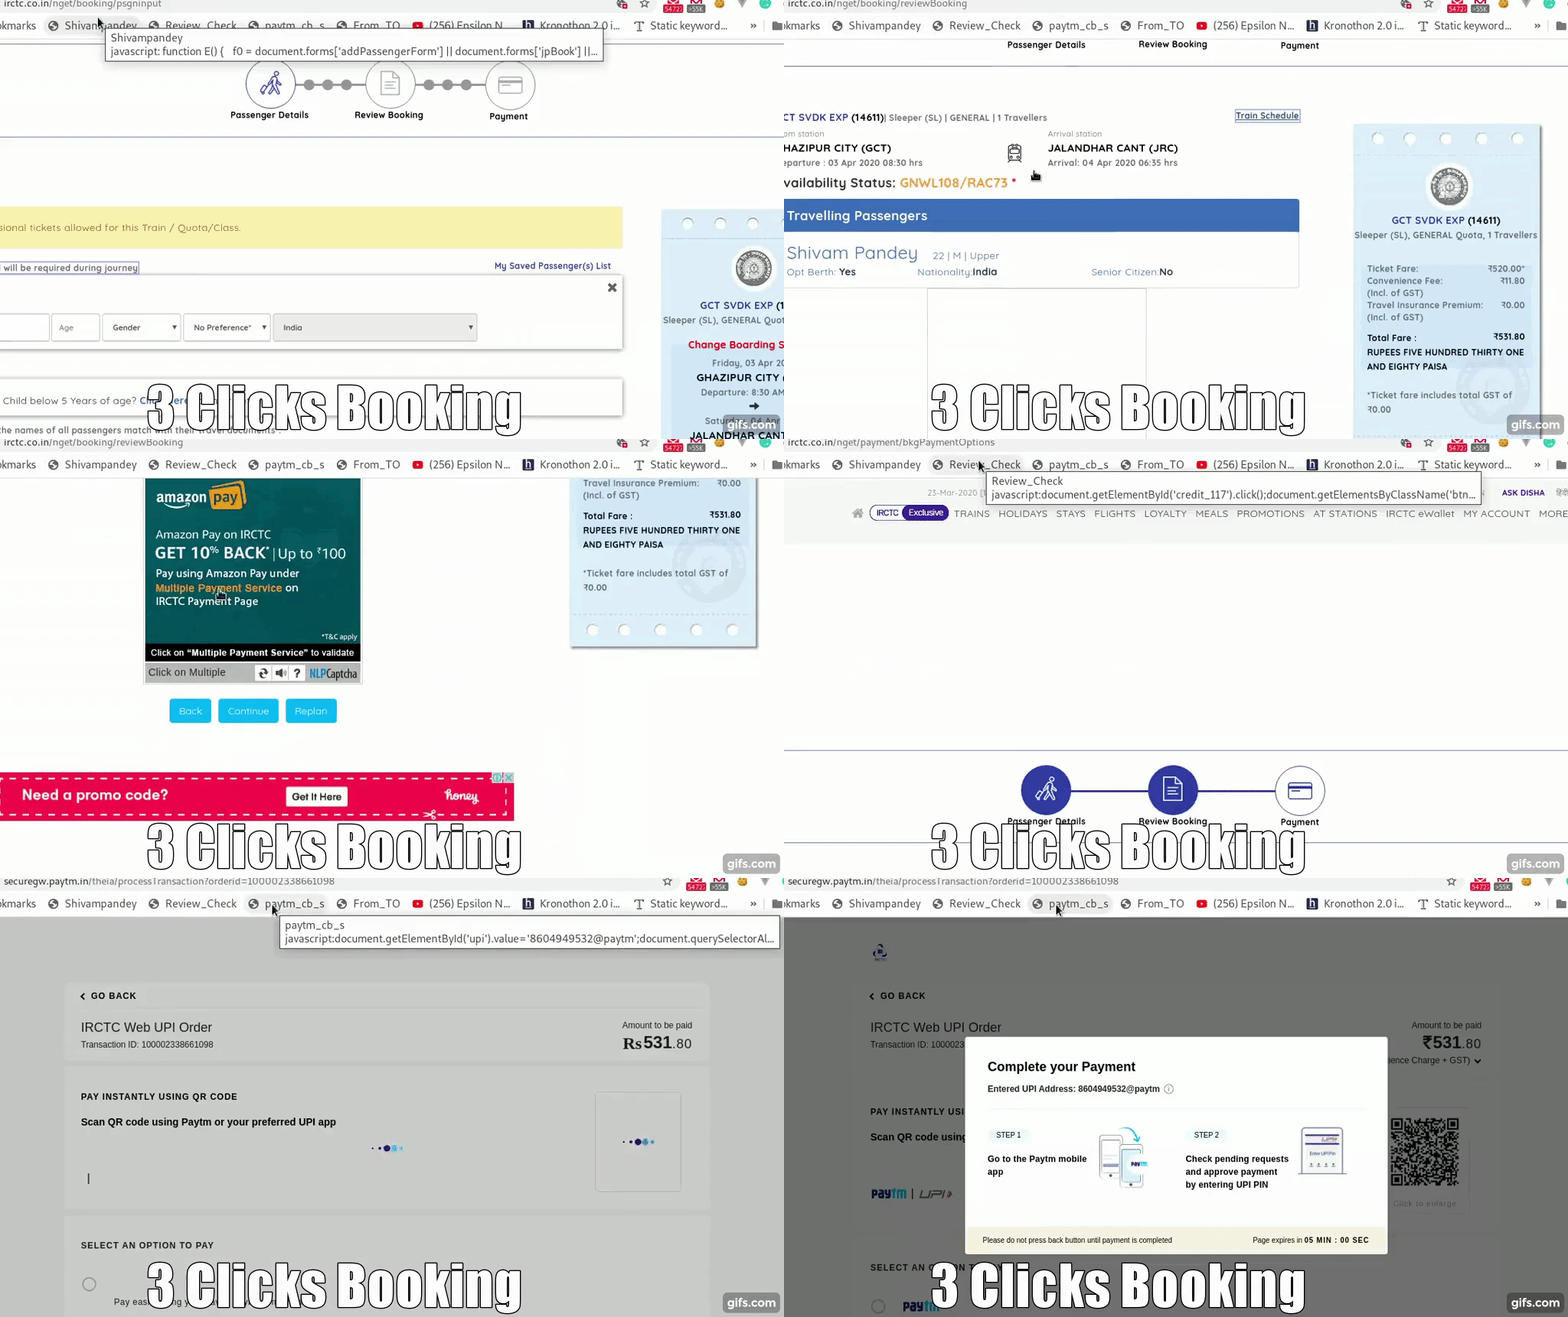
Author: if7jirx67fzp

  • IRCTC-Filling-Script

    IRCTC-Filling-Script

    Add multiple bookmarks to ease your flow with specific clicks

    To Add multiple passenger list just add new array element

    To click add passenger

    change travelling_passenger as per your need

    travelling_passenger = 2;
    while (travelling_passenger > 1) {
        document.getElementsByClassName('prenext')[1].click()
        // This will create new array values for more passenger example a[1] will exist now
        travelling_passenger--;
    }
    var a, b, c, d;
    a = document.querySelectorAll("input[placeholder*='Name']"), b = document.querySelectorAll("input[placeholder*='Age']"), c = document.querySelectorAll("select[formcontrolname*='passengerGender']"), d = document.querySelectorAll("select[formcontrolname*='passengerBerthChoice']"), d1 = document.querySelectorAll("select[formcontrolname*='passengerFoodChoice']");
    a[0] && (a[0].value = 'Shivam Pandey', a[0].dispatchEvent(new Event('input')));
    b[0] && (b[0].value = '22', b[0].dispatchEvent(new Event('input')));
    c[0] && (c[0].value = 'M', c[0].dispatchEvent(new Event('change')));
    

    Eligible values

    LB (Lower Birth)

    MB (Middle Birth)

    UB (Upper Birth)

    SL (Side Lower)

    SU (Side Upper)

    d[0] && (d[0].value = 'UB', d[0].dispatchEvent(new Event('change')));
    
    
    a[1] && (a[1].value = 'Rahul Pandey', a[1].dispatchEvent(new Event('input')));
    b[1] && (b[1].value = '22', b[1].dispatchEvent(new Event('input')));
    c[1] && (c[1].value = 'M', c[1].dispatchEvent(new Event('change')));
    d[1] && (d[1].value = 'SL', d[1].dispatchEvent(new Event('change')));
    

    Example to make payment through upi add this as bookmark value

    javascript:
     document.getElementById('2').click();document.querySelectorAll("button[type='submit']")[1].click();
    

    For Review Check @contributed by shivam_pandey

    document.getElementById('credit_117').click();
    document.getElementsByClassName('btn_continue ng-star-inserted')[0].click();
    

    For final paytm booking @contributed by shivam_pandey

    javascript:
    document.getElementById('upi').value='8604949532@paytm';
    document.querySelectorAll("button")[2].click();
    

    From

    document.querySelectorAll("input[placeholder='From*']")[0].value="GHAZIPUR CITY - GCT";
    document.querySelectorAll("input[placeholder='From*']")[0].dispatchEvent(new Event('keydown'));
    document.querySelectorAll("input[placeholder='From*']")[0].dispatchEvent(new Event('input'));
    

    To

    document.querySelectorAll("input[placeholder='To*']")[0].value="JALANDHAR CANT - JRC";
    document.querySelectorAll("input[placeholder='To*']")[0].dispatchEvent(new Event('keydown'));
    document.querySelectorAll("input[placeholder='To*']")[0].dispatchEvent(new Event('input'));
    

    date

    document.querySelectorAll("input[placeholder='Journey Date(dd-mm-yyyy)*']")[0].value="03-04-2020";
    document.querySelectorAll("input[placeholder='Journey Date(dd-mm-yyyy)*']")[0].dispatchEvent(new Event('keydown'));
    document.querySelectorAll("input[placeholder='Journey Date(dd-mm-yyyy)*']")[0].dispatchEvent(new Event('input'));
    

    Find Train

    document.querySelectorAll("button[type='submit']")[1].click();
    
    Visit original content creator repository https://github.com/shivamguys/IRCTC-Filling-Script
  • Phishing-detection-using-AI

    Phishing-detection-using-AI

    Decision Tree and SVM(Support Vector Machine) AI algorithms to detect phishing emails

    Explanation

    Support Vector Machine (SVM) is a type of supervised machine learning algorithm that can be used for classification or regression tasks. SVM works by finding the hyperplane in a high-dimensional space that maximally separates the different classes. The points closest to the hyperplane are called support vectors, and the distance between the hyperplane and the support vectors is called the margin. SVM tries to maximize the margin in order to find the best hyperplane.

    Decision Tree is a type of supervised machine learning algorithm that can be used for classification or regression tasks. It works by constructing a tree-like model of decisions and their possible consequences, including chance event outcomes, resource costs, and utility. Decision Tree makes predictions based on the values of the features in the data, and it can handle categorical and numerical data.

    Usage

    First of all everything here is developed using Python language, help of CSV file for dataset and we used VSCode, so you need to have python installed in your device also u need to have pip installed.
    We used some libraries that are needed to implement these 2 algorithms, they can be installed in VSCode terminal or in shell just u need to run as administrator
    and then you write like this for each one:
    pip install pandas
    pip install -U scikit-learn
    After you get these libraries I believe you will be ok to run the python file. In this code we didn’t get so deep into AI so we just wanted to make AI predict phishing in our dataset of emails. Our dataset has 4 features which we think are enough for good results but u can add more if u want. Also if you take code just let credits and you can easily change, modify, copy or anything else that u need.

    Authors

    Visit original content creator repository
    https://github.com/lorentsinani/Phishing-detection-using-AI

  • memegen-flask

    Memegen

    An API to programatically generate memes based solely on requested URLs.

    Unix Build Status Windows Build Status Coverage Status Scrutinizer Code Quality License

    ⚠️ This project is now archived. See jacebrowning/memegen for active development.

    Generating Images

    The API is stateless so URLs contain all the information necessary to generate meme images. For example, http://localhost:5000/buzz/memes/memes_everywhere.jpg produces:

    Sample Image

    But, the site can also produce masked URLs to conceal the joke:

    http://localhost:5000/_YnV6egltZW1lcy9tZW1lcy1ldmVyeXdoZXJl.jpg

    For any image, lose the extension to see a list of all format options:

    http://localhost:5000/buzz/memes/memes_everywhere

    Special Characters

    In URLs, spaces can be inserted using underscores, dashes, or mixed case:

    • underscore (_) → space ( )
    • dash (-) → space ( )
    • 2 underscores (__) → underscore (_)
    • 2 dashes (--) → dash (-)
    • “weLoveMemes” → “we love memes”

    Reserved URL characters can be escaped:

    • tilde + Q (~q) → question mark (?)
    • tilde + P (~p) → percentage (%)
    • tilde + H (~h) → hashtag/pound (#)
    • tilde + S (~s) → slash (/)
    • 2 single qutoes ('') → double quote (")

    For example, http://localhost:5000/doge/~hspecial_characters~q/underscore__-dash–.jpg produces:

    Escaped Characters

    Alternate Styles

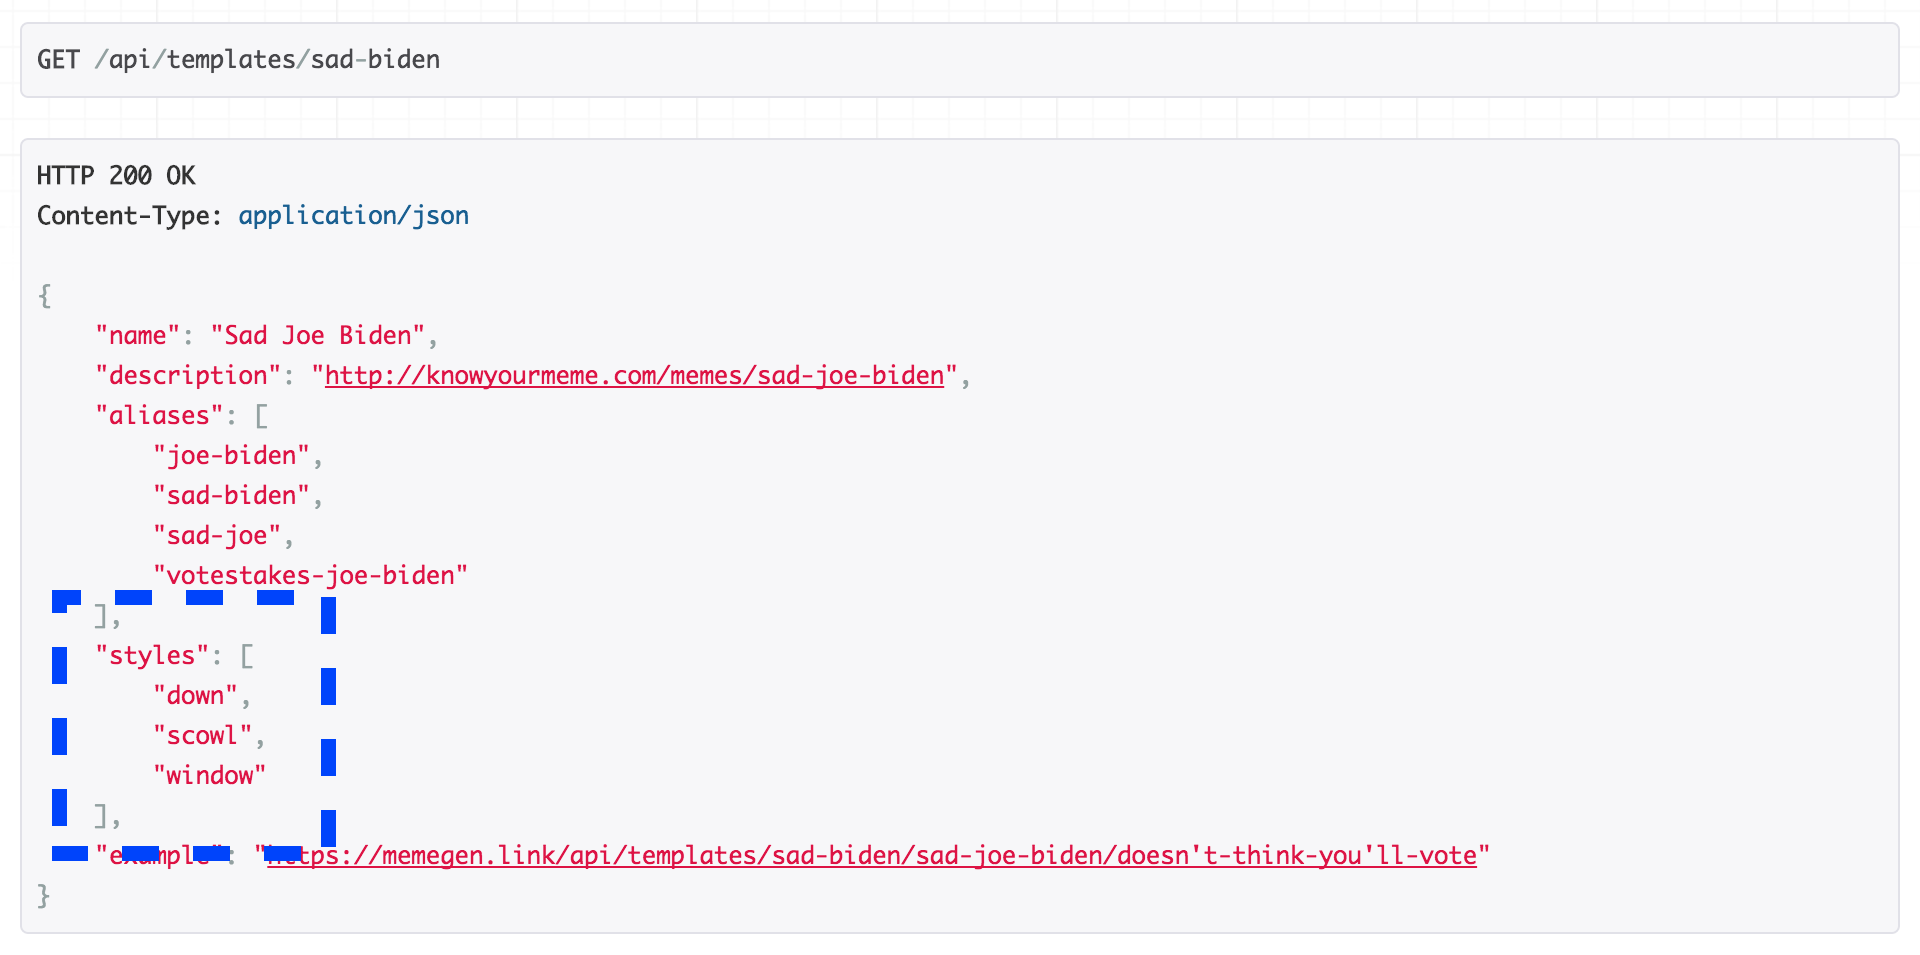
    Some memes come in multiple forms, which can be selected via ?alt=<style>:

    Sample Image

    For example: http://localhost:5000/sad-biden/sad_joe_biden/doesn’t_think_you’ll_vote.jpg?alt=scowl

    Or, you can use your own image URL as the style. For example, http://localhost:5000/custom/my_pretty/background.jpg?alt=http://www.gstatic.com/webp/gallery/1.jpg produces:

    Custom Background

    Alternate Fonts

    Additional fonts are available (see: http://localhost:5000/api/fonts) and can be selected via ?font=<name>.

    For example, http://localhost:5000/joker/pick_a_different_font/people_lose_their_minds.jpg?font=typoline-demo produces:

    Custom Font

    Custom sizes

    Images can be scaled to a specific width via ?width=<int> or a specific height via ?height=<int>. If both parameters are provided (?width=<int>&height=<int>), the image will be padded to the exact dimensions.

    For example, http://localhost:5000/both/width_or_height/why_not_both~q.jpg?height=350&width=600 produces:

    Custom Size

    Preview Images

    API clients that want to show a preview of an image while the user is still typing should disable caching and analytics via ?preview=true.

    Social Media

    Add ?share=true to get HTML with images optimized for sharing on social media.

    Adding Templates

    To add a new template, please follow the contributor instructions.

    Thanks go to danieldiekmeier/memegenerator for the inspiration!

    Sample Clients

    Platforms Link Source
    Slack Python: nicolewhite/slack-meme
    Slack Go: CptSpaceToaster/slackbot
    Slack http://www.memetizer.com
    Hain JavaScript: Metrakit/hain-plugin-meme
    Web Clojure: jasich/mighty-fine-memes
    Web, Slack https://memecomplete.com

    Additional clients can be found by searching for code examples on GitHub.

    Visit original content creator repository https://github.com/jacebrowning/memegen-flask
  • pixl

    Pixl

    Pixl is a tiny board used to create low cost robots based on Raspberry Pi board and Dynamixel XL320 motors. It is used on the Poppy Ergo Jr robot.

    This GitHub repository is only made for keeping a copy of productions files without having to log in circuit maker.

    How to get one

    • You can purchase one at Generation Robots website.
    • The release contains production files, you can send them to a PCB (with components mounting) seller. We used to buy it from Synergy near Bordeaux.

    Features

    • It powers up the Raspberry Pi from the 7,5V motor power with an embedded voltage converter.
    • It provides a conversion from the 5V TTL half duplex bus of Dynamixel motors from the 3.3V UART ports of the Raspberry Pi.
    • You can power up your motors and the Raspberry Pi from a 7.5V as well as with Robotis batteries (LBB-040).

    Mounting

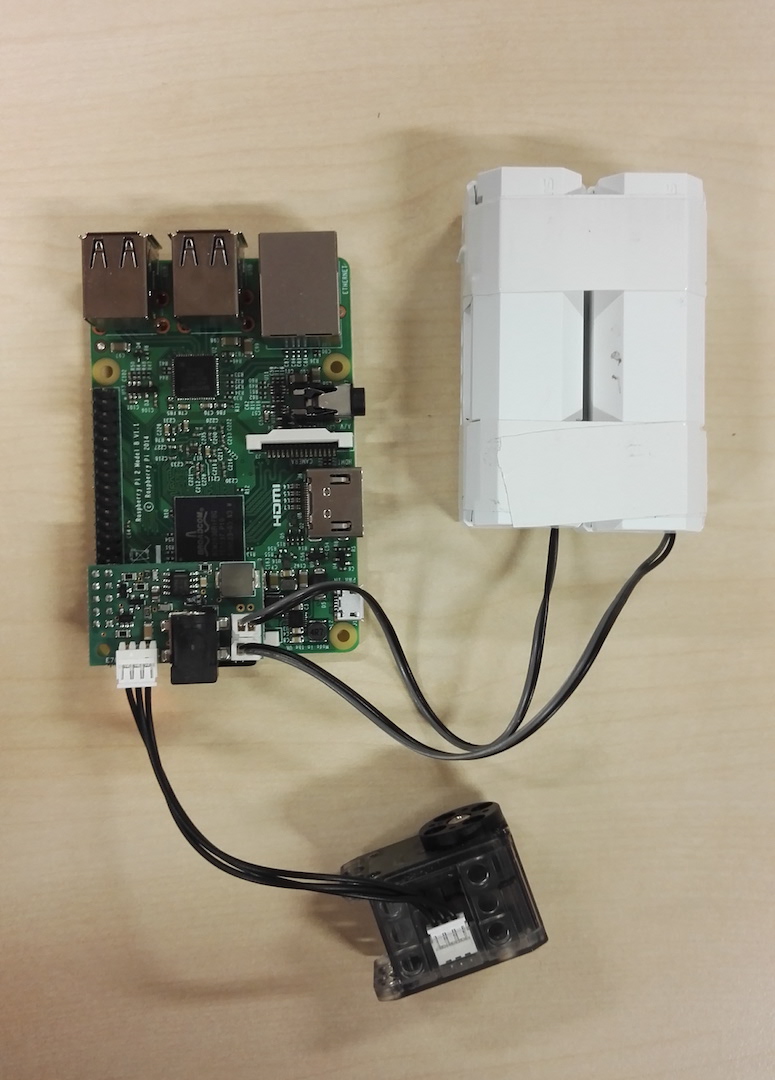
    The Pixl board plugs into the pins 1 to 10 off the Raspberry Pi, please make sure the hole of the Pixl board is aligned to that of the raspberry pi, like that : To power up your system you have the black Jack DC plug as power input (2,1 mm, 5,5 mm) designed for an external power supply able to output 7.5V at least 2A (ECP-15-7.5E), or you can plug your LBB-040 battery holder on the twice two pins connector like that :

    Precautions

    • You need to swith off the power supply of the Pixl board before to put in or to take off the Pixl board of the Raspberry pi. Otherwise, there is a small risk to burn the power converter of the Pixl board.
    • Do not use batteries in addition to DC plug.
    • Do not reload batteries plugged on the Pixl board, please unmount it before recharging.

    Limitation

    This board has been designed to drive 6 motors, some people use it to drive up to 24 motors but it may increase the number of communication errors.

    Contributing

    The board is made with circuitmaker, a EDA software tool from Altium available as freeware for any kind of projects.

    To modify the board or export the last production files, follow this link. An account on CircuitMaker is needed to download documents.

    You can share your experience, new design, ideas or questions on the Poppy project forum.

    Licence

    This board is licenced under the Creative Commons Attribution-ShareAlike 3.0 (CC-BY-SA) licence.

    Visit original content creator repository https://github.com/poppy-project/pixl
  • whip-whep-js

    Build status npm package

    whip.js

    WHIP client javascript module

    Example

    import { WHIPClient } from "whip.js"
    
    //Get mic+cam
    const stream = await navigator.mediaDevices.getUserMedia({audio:true, video:true});
    
    //Create peerconnection
    const pc = new RTCPeerConnection({ bundlePolicy: "max-bundle" });
    
    //Send all tracks
    for (const track of stream.getTracks()) {
    	//You could add simulcast too here
    	pc.addTransceiver(track, { 'direction': 'sendonly' });
    }
    
    //Create whip client
    const whip = new WHIPClient();
    
    const url = "https://whip.test/whip/endpoint";
    const token = "eyJhbGciOiJIUzI1NiIsInR5cCI6IkpXVCJ9.eyJzdWIiOiIxMjM0NTY3ODkwIiwibmFtZSI6IndoaXAgdGVzdCIsImlhdCI6MTUxNjIzOTAyMn0.jpM01xu_vnSXioxQ3I7Z45bRh5eWRBEY2WJPZ6FerR8";
    
    //Start publishing
    whip.publish(pc, url, token);


    whep.js

    WHEP client javascript module

    Example

    import { WHEPClient } from "whep.js"
    
    //Create peerconnection
    const pc = window.pc = new RTCPeerConnection({ bundlePolicy: "max-bundle" });
    
    //Add recv only transceivers
    pc.addTransceiver("audio");
    pc.addTransceiver("video");
    
    pc.ontrack = (event) =>
    {
    	console.log(event)
    	if (event.track.kind == "video")
    		document.querySelector("video").srcObject = event.streams[0];
    }
    
    //Create whep client
    const whep = new WHEPClient();
    
    const url = "https://whep.test/whep/endpoint";
    const token = "eyJhbGciOiJIUzI1NiIsInR5cCI6IkpXVCJ9.eyJtaWxsaWNhc3QiOnsidHlwZSI6IlN1YnNjcmliZSIsInNlcnZlcklkIjoidmlld2VyMSIsInN0cmVhbUFjY291bnRJZCI6InRlc3QiLCJzdHJlYW1OYW1lIjoidGVzdCJ9LCJpYXQiOjE2NzY2NDkxOTd9.ZE8Ftz9qiS04zTKBqP1MHZTOh8dvI73FBraleQM9h1A"
    
    //Start viewing
    whep.view(pc, url, token);
    
    
    Visit original content creator repository https://github.com/medooze/whip-whep-js
  • Kaggle_HousingPricePrediction

    House Prices (AmesHousingData): Advanced Regression Techniques

    Link to Kaggle Competition: https://www.kaggle.com/c/house-prices-advanced-regression-techniques

    Brief about the dataset:

    The Ames Housing dataset was compiled by Dean De Cock for use in data science education. (http://jse.amstat.org/v19n3/decock.pdf)

    With 79 explanatory variables describing (almost) every aspect of residential homes in Ames, Iowa, this competition challenges you to predict the final price of each home.

    Goal: To predict the sales price for each house. For each Id in the test set, you must predict the value of the SalePrice variable.

    Data Manipulation & Feature Engineering:

    With multiple categorical & numerical variables to play around, the dataset poses a great challenge in terms of data manipulation and feature engineering. Dealing each feature individually to address it in a right way is the key to this competition. (More details in the notebook: DataCleaning & Feature Engineering.ipynb)

    Evaluation Metric:

    Log-RMSE: Root-Mean-Squared-Error (RMSE) between the logarithm of the predicted value and the logarithm of the observed sales price. (Taking logs means that errors in predicting expensive houses and cheap houses will affect the result equally)

    Modelling:

    I’ve tried out various models and digged deep into most of them to further tune the hyper-parameters and optimise them to maximise the performance of the model. (Detailed more in the notebook: RegressionModels.ipynb)

    Various implemented models and their performance on the validation holdout set are as follows:

    Model Holdout
    Log-RMSE
    Baseline
    (Average SalePrice of Train Dataset)
    0.4166
    Linear Regression 0.1312
    LR – RIDGE Regression 0.1130
    LR – LASSO Regression 0.1109
    Random Forest 0.1536
    Gradient Boosted Regression (GBR) 0.1254
    XGBoost Regression 0.1084
    Ensemble/Stacking Model
    (LASSO + RIDGE + GBR + XGBoost)
    0.1067


    Visit original content creator repository
    https://github.com/abvnithish/Kaggle_HousingPricePrediction

  • vue-js-translations

    vue-js-translations

    Javascript friendly translations plugin for Vue.

    Usage

    Set locale

    this.$t = 'en';

    Vue dom

    <p>{{$t.lang}}</p>
    <p>{{$t.messages.welcome('guest')}}</p>
    <p>{{$t.errors['404']}}</p>

    In pure Javascript

    import translations from 'your/path';
    //set
    translations.$t = 'en';
    //get
    translations.$t.lang;
    translations.$t.messages.welcome('guest');
    translations.$t.errors['404'];

    Static variables

    $t.locale;// current locale key
    $t.instance;// get translations instance

    Import

    import translations from 'your/path';
    import en from '@/locales/en';
    import zh from '@/locales/zh';
    
    Vue.use(translations, {
        alias: '$t', //default $t
        defaultLocale: 'en',
        locales: { en, zh }
    });
    
    // Can support multiple translations instance in one application
    import en2 from '@/locales2/en';
    import zhHant2 from '@/locales2/zh-hant';
    Vue.use(translations, {
        alias: '$t2',// use alias to identify each instance
        defaultLocale: 'en',
        locales: { 'en': en2, 'zh-hant': zhHant2 }
    });

    or get ALL locales from directory

    import Vue from 'vue';
    import translations from 'your/path';
    
    let locales = [];
    let req = require.context("@/locales", true, /\.js$/);
    req.keys().forEach(key => {
        locales[key.match(/^.\/(.*).js$/)[1]] = req(key).default
    });
    
    Vue.use(translations, {
        alias: '$t',
        defaultLocale: 'en',
        locales
    });

    /locales/en.js

    export default {
        /*
         * Since "locale", "instance" are static variables,
         * the value set to them will be overrided!
         */
        locale: 'will be overrided',
        instance: 'will be overrided',
    
        pages: { // For menus
            home: 'Home',
        },
        actions: { // For buttons
            login: 'Login',
            logout: 'Logout',
        },
        keywords: {
            development: 'Development',
        },
        messages: {
            welcome: (name) => `Welcome ${name}.`,
        },
        validations: {
        },
        errors: {
            '404': 'Page Not Found',
        }
    }

    /locales/zh.js

    export default {
        pages: {
            home: '首頁'
        },
        actions: {
            login: '登入',
            logout: '登出',
        },
        keywords: {
            development: '開發'
        },
        messages: {
            welcome: (name) => `歡迎,${name}。`,
        },
        validations: {
        },
        errors: {
            '404': '找不到頁面',
        }
    }

    With vue-router

    If you use URL to control the locale, e.g. http://localhost/en/path

    VueRouter config

    import translations from 'your/path';
    const instanceT = translations.$t.instance;
    
    const router = new VueRouter({
      routes: [
        {
          path: "https://github.com/",
          redirect: "https://github.com/" + instanceT.defaultLocale // default
        },
        {
          path: '/:locale',
          component: () => import('@/components/AppFrame'), // component which contains child router-view
          children: routes // your routes
        },
      ]
    });
    
    router.beforeEach((to, from, next) => {
      let locale = to.params.locale;
      if (!instanceT.localeKeys.includes(locale)) {
        next("https://github.com/" + instanceT.defaultLocale + to.fullPath);
        return;
      }
      translations.$t = locale; //update locale
      next();
    });

    Root router-view

    You should add a key into the router-view tag for updating the locale.

    <router-view :key="$route.params.locale"/>

    Visit original content creator repository
    https://github.com/chunlampang/vue-js-translations

  • code_flowchart

    code-flowchart

    GitHub Tag PyPI - Version PyPI - Python Version GitHub License

    code-flowchart is a simple tool for generating flowcharts (in both DOT and PNG formats) directly from your Python source code. It leverages Python’s built-in AST (Abstract Syntax Tree) parsing and utilizes Graphviz to render visual diagrams.

    Installation

    Install via pip:

    pip install code-flowchart

    Note
    This tool depends on Graphviz. Even if you install a Python package for Graphviz, you might need to install Graphviz system-wide or configure your environment path. If you encounter issues, try installing Graphviz via conda:

    conda install graphviz

    Usage

    Once installed, you can run code-flowchart from the command line:

    code_flowchart {python_file_path} -o {output_file_name}
    • {python_file_path}: Path to your Python source file.
    • -o {output_file_name}: (Optional) Output filename prefix. By default, it saves as code_flowchart.dot and code_flowchart.png.

    The command will generate a DOT file (.dot) and a corresponding PNG image in the current directory.

    Example

    Consider the following main.py

    def isOdd(num):
        if not num%2==0:
            return True
        else:
            print("It's not odd!!!")
        return False
    
    for i in range(3):
        print(isOdd(i))

    To create a flowchart (DOT + PNG), simply run:

    code_flowchart main.py -o output

    output.dot

    Click to expand
    digraph {
    	rankdir=TB
    	nodesep=0.5 ranksep=0.75
    	dpi=300 size="10,10"
    {rank=source; "start_1";}{rank=same; "for_2";}{rank=same; "expr_3";}{rank=same; "call_4";}{rank=same; "function_5";}{rank=same; "if_6";}{rank=same; "return_7";}{rank=same; "else_8";}{rank=same; "return_9";}{rank=same; "if_end_10";}	return_7 -> call_4 [label=Return color=black fontsize=10 style=dashed]
    	return_9 -> call_4 [label=Return color=black fontsize=10 style=dashed]
    {rank=sink; "end_11";}	subgraph cluster_functions {
    		color=green fontsize=16 label=Functions style=dashed
    		function_5 [label="Function: isOdd" fontsize=12 shape=ellipse]
    		if_6 [label="If: num % 2 == 0" fontsize=12 shape=diamond]
    		function_5 -> if_6 [label="" color=black fontsize=10 style=solid]
    		return_7 [label="Return: \"It's not odd!!!\"" fontsize=12 shape=box]
    		if_6 -> return_7 [label=True color=black fontsize=10 style=solid]
    		else_8 [label=Else fontsize=12 shape=diamond]
    		if_6 -> else_8 [label=False color=black fontsize=10 style=solid]
    		return_9 [label="Return: \"It's odd!!!\"" fontsize=12 shape=box]
    		else_8 -> return_9 [label="" color=black fontsize=10 style=solid]
    		if_end_10 [label="If End" fontsize=12 shape=circle]
    	}
    	subgraph cluster_main {
    		color=blue fontsize=16 label="Main Code" style=dashed
    		start_1 [label=Start fontsize=12 shape=ellipse]
    		for_2 [label="For: i in range(3)" fontsize=12 shape=box]
    		start_1 -> for_2 [label="" color=black fontsize=10 style=solid]
    		expr_3 [label="Expression: print(isOdd(i))" fontsize=12 shape=box]
    		for_2 -> expr_3 [label="" color=black fontsize=10 style=solid]
    		call_4 [label="Call: isOdd(i)" fontsize=12 shape=box]
    		expr_3 -> call_4 [label="Arg Call" color=black fontsize=10 style=solid]
    		call_4 -> function_5 [label=Call color=black fontsize=10 style=dashed]
    		expr_3 -> for_2 [label=Repeat color=black fontsize=10 style=dotted]
    		end_11 [label=End fontsize=12 shape=ellipse]
    		for_2 -> end_11 [label="" color=black fontsize=10 style=solid]
    	}
    }

    output.png

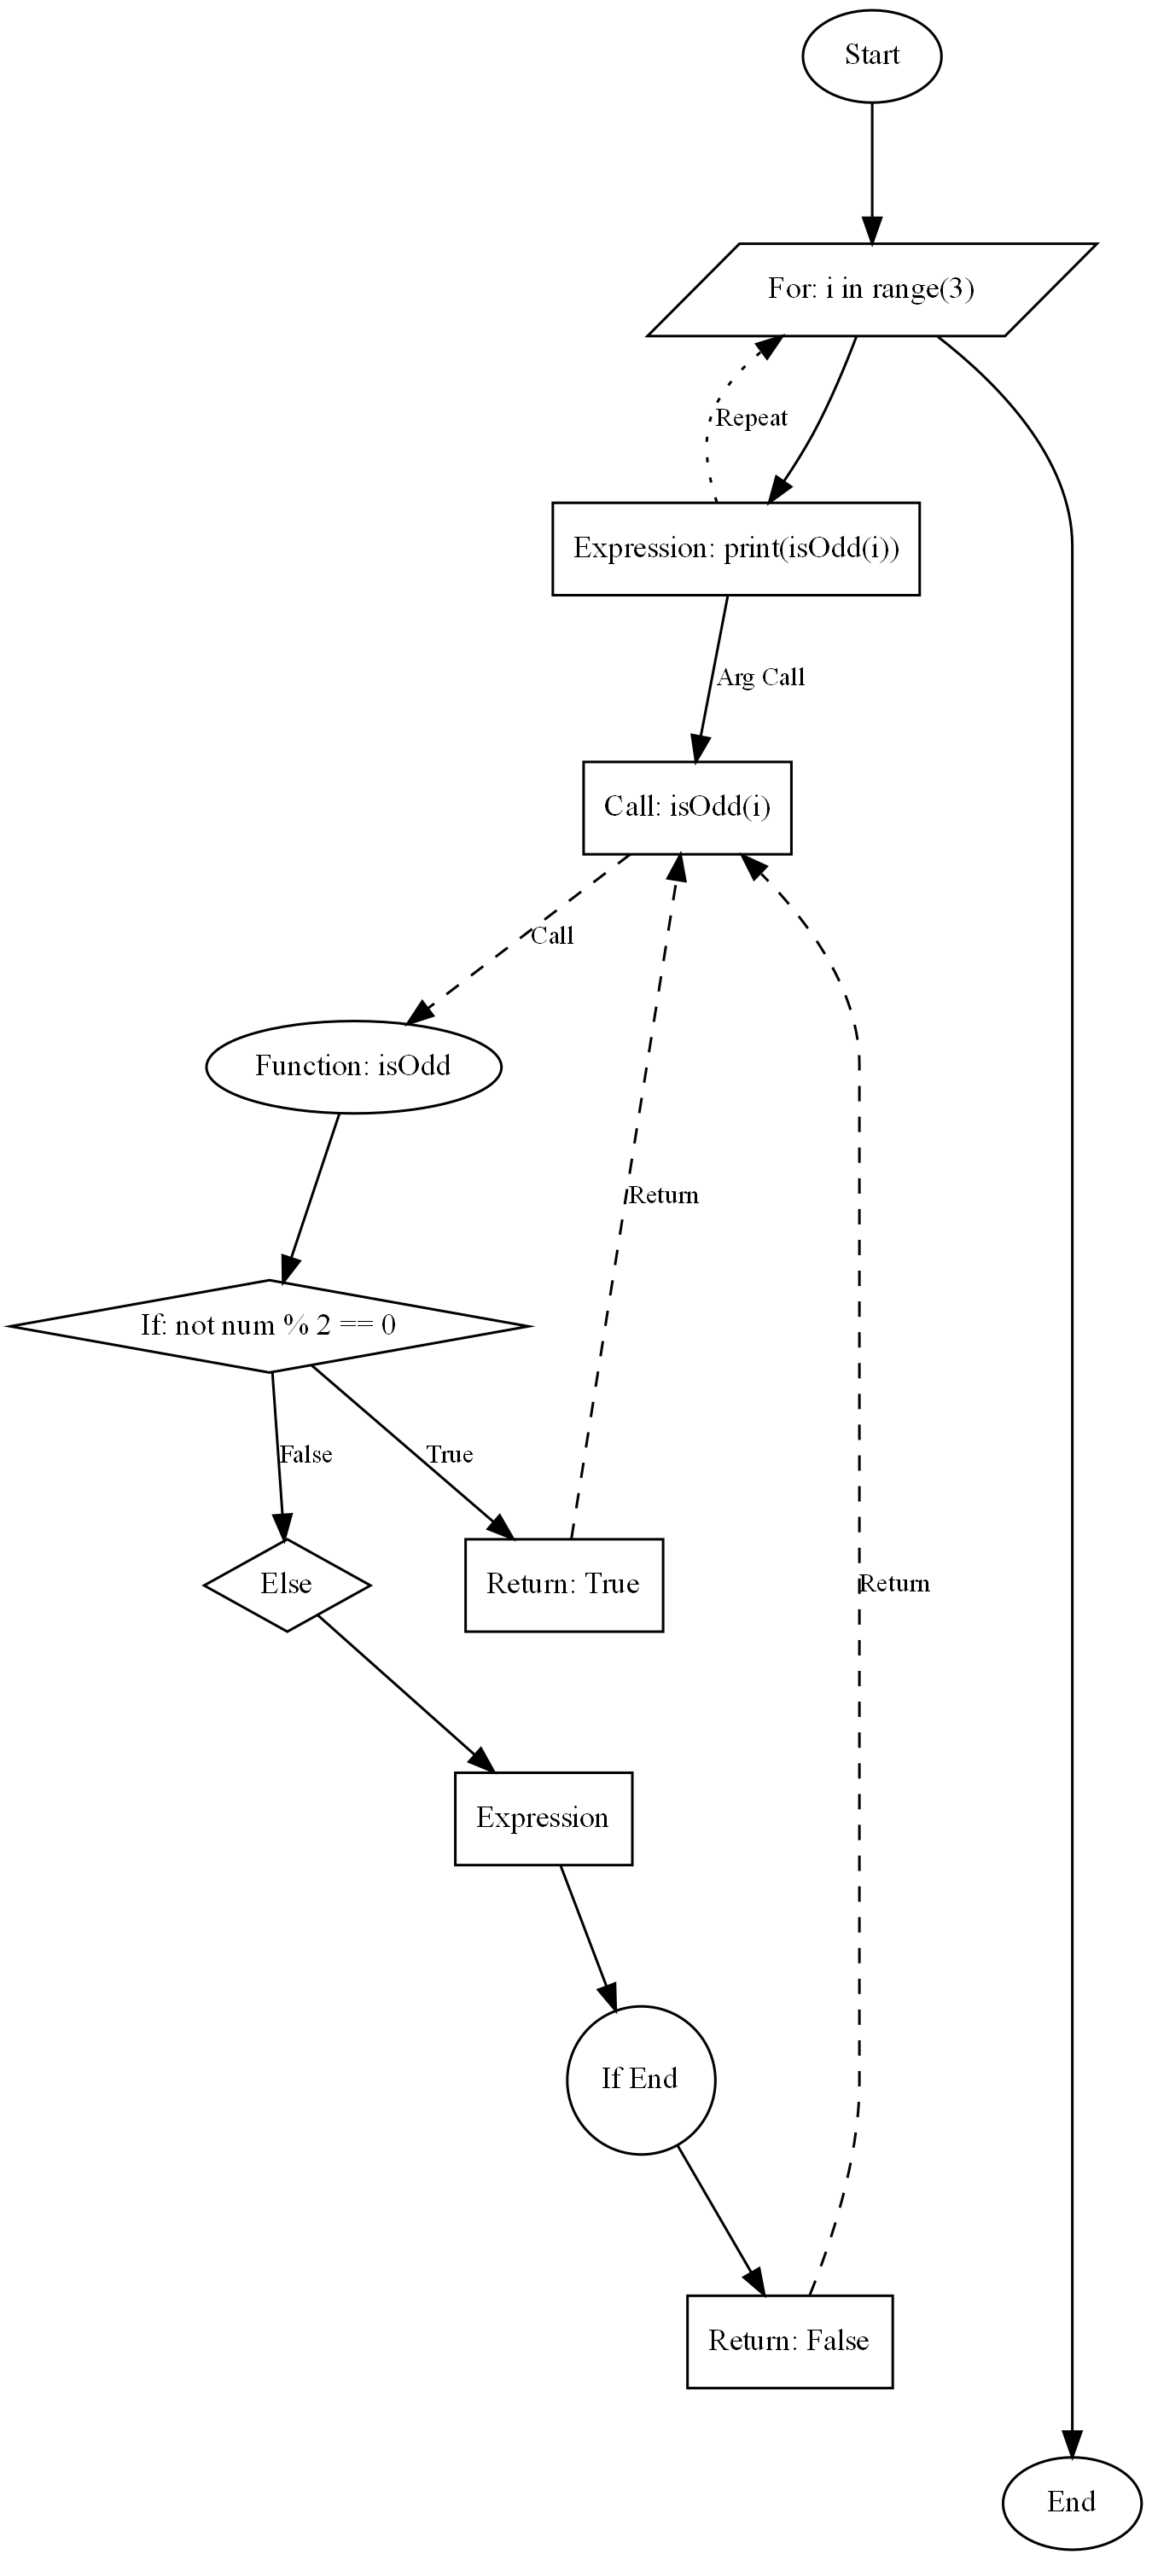
    Below is a preview of the generated flowchart (the actual image may vary based on the code and your Graphviz configuration):

    Supported syntax

    The library currently supports visualizing:

    • FunctionDef (function definitions)
    • Call (function calls, including user-defined functions)
    • If / Else / Elif
    • For
    • While
    • Return
    • Expr (print, assignments, or any standalone expressions) Other Python syntax nodes are either skipped or handled as generic expressions.

    License

    This project is licensed under the MIT License.
    Feel free to use, modify, and distribute this tool in accordance with the license terms.
    Contributions are welcome!

    Visit original content creator repository https://github.com/16st58/code_flowchart
  • Petlove-docs

    👋 Introdução

    Aplicação “Self Awareness”

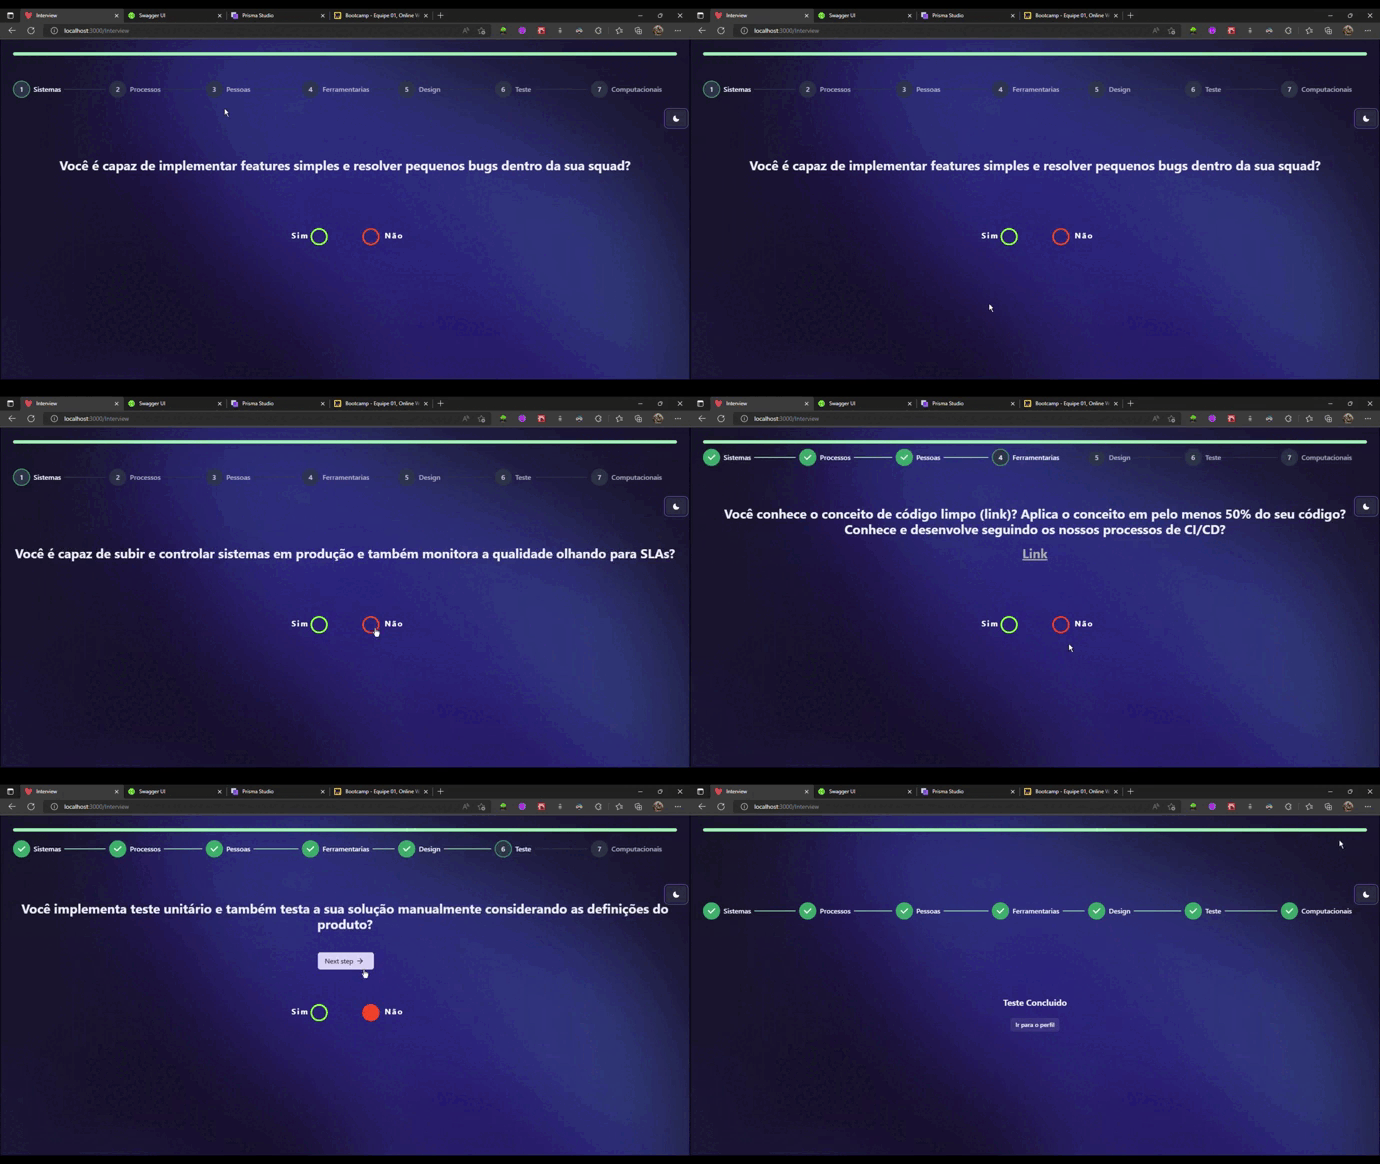
    A aplicação foi criada com o intuito de testes e visualizar a evolução dos profissionais de TI através de testes onde o mesmo possa avaliar as suas competências através de algumas perguntas propostas pelos seus gestores e sobre sua evolução referente a certos processos que o profissional foi adquirindo e melhorando durante suas atividades.

    Com a proposta de ser uma aplicação de escopo mais privado para cada setor de sua empresa, toda a parte de informações e de visualizações referem-se ao teste que será apresentado para o profissional após o acesso da plataforma e também na visualização de seu histórico profissional referente aos conhecimentos adquiridos, em que o usuário e os administradores possam visualizar cada resultado dos seus testes passados, podendo fazer uma breve comparação gráfica de sua evolução e sobre a sua hierarquia como profissional de TI.

    Referente aos perfis administradores, os mesmos teriam acesso total aos testes que foram realizados por diferentes colaboradores com acesso a plataforma, podendo eles filtrarem os resultados e os testes realizados por nome, função e os tipos de equipes que cada colaborador pertence.

    Como obrigatoriedade, os administradores cuidam da parte de aprovação e dos tipos de funções e hierarquias de seus colaboradores através dos resultados de seus testes, podendo assim gerir melhor as funções de seus profissionais dentro de cada projeto.

    _______________________________________________________________________________________________

    Como é realizado a avaliação:

    O teste é composto de 27 perguntas, divididas entre 5 eixos de avaliação.

    Nível pessoal:

    • Pessoas -> Focado em avaliar o relacionamento interpessoal dentro e fora da squad.
    • Processos -> Focado em avaliar engajamento e organização com os processos definidos pelo time de tecnologia.
    • Sistemas -> Focado em avaliar o conhecimento sistêmico organizacional da empresa.
    • Influência -> Média ponderada feita entre Pessoas, Processos e Sistemas que avalia o impacto geral do nível pessoal.

    Nível Técnico:

    • Tecnologia -> Avaliação técnica com os conhecimentos de hard-skills do desenvolvedor.

    _______________________________________________________________________________________________

    Visualização dos resultados

    Após a realização do teste por parte do usuário, o mesmo é redirecionado para a página de seu perfil onde pode visualizar seu resultado através dos gráficos disponíveis. O colabora assim como seu gestor são notificados pela realização do teste através do site e por seu email cadastrado.

    Boa parte do histórico do usuário é integrado com alguns gráficos em que mostra o resultado de todas as categorias dos testes, como também de forma separada e do histórico de testes realizados para comparação de evolução do usuário de forma dinâmica.

    _______________________________________________________________________________________________

    Repositórios da aplicação

    Ambas as aplicações, estão disponíveis de forma publica no Github junto com os links dos deploys.

    Repositório Front-end: https://github.com/pedroasdoliveira/Petlove-Project-Frontend;

    Repositório Back-end: https://github.com/pedroasdoliveira/Petlove-Project-Backend;

    Já os links dos deploys da aplicação se encontram em #deploy

    _______________________________________________________________________________________________

    Para mais detalhe sobre a aplicação segue os links da api.md e sobre tecnologias-utilizadas.md. E também os links de Broken link sobre todas as páginas e componentes da aplicação.

    Caso queira instalar o projeto em sua máquina siga os passos na página de instalacao.md.

    Visit original content creator repository https://github.com/pedroasdoliveira/Petlove-docs